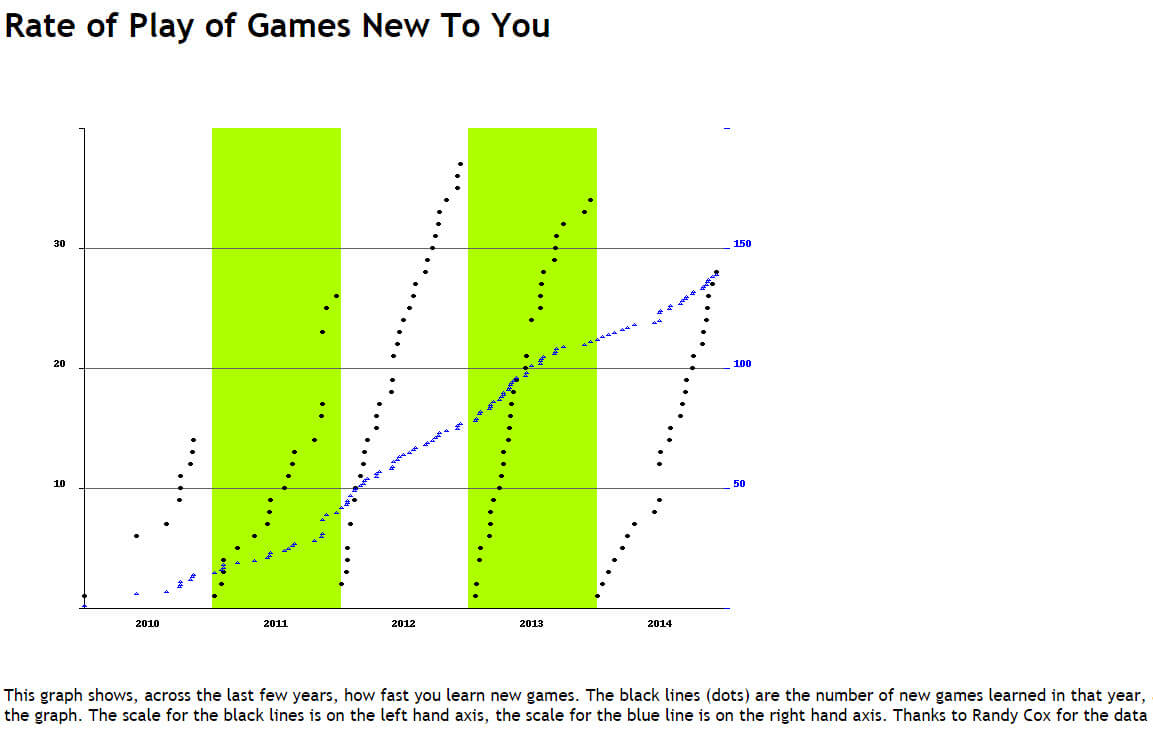
“This graph shows, across the last few years, how fast you learn new games. The black lines (dots) are the number of new games learned in that year, and the blue line (triangles) is the number of new games learned since the beginning of the graph. The scale for the black lines is on the left hand axis, the scale for the blue line is on the right hand axis. ”
So I am learning new games at a decreasing rate but still moving along I suppose. 26 new games in 2014 versus 35 in 2013 and nearly 40 in 2012. Interesting.

